

Mercator charts have been described in the module for chart projections. Here, we will shortly discuss some principles involved in the construction of the mercator chart and then learn the calculations involving mercator sailing.
Some Principles involved in calculation of Mercator chart:
- Mercator chart is based on “Cylindrical Orthomorphic Projection”.
- Latitudes appear as parallel horizontal straight lines to the equator. In actuality, we know that the longitudes coverage at the poles. Hence, the distance between the longitudes is maximum at the equator and reduces as latitude increases towards the poles.
- In the mercator chart, meridians are represented by equidistant parallel straight lines. Therefore the east-west distortion on chart increases as the latitude increases.
- To maintain the orthomorphic property of the chart, it is therefore necessary to deliberately introduce an equal north-south distortion, which is just like the east-west distortion and should increase towards the pole.
- Due to the reason mentioned above, the distance between successive parallels of latitude on Mercator chart will increase towards the pole.
- As the nautical mile is defined as the length of the meridian between two geographic latitudes which differ by 1’ (i.e. 1’ of d’lat) – on the mercator chart, the length of a nautical mile on increases pole ward – as nautical miles are measured on the latitude scale.
- As seen earlier, on a Mercator chart, since the length of the meridian between two parallel of latitude increases towards the pole a concept of Meridional part has been introduced.

Definition of a “Meridional Part”
The “Meridional parts” for any latitude is the length of the meridian between the equator and that latitude on a mercator chart measured in units of longitude scale, i.e. the number of times one minute of longitude can be laid along a meridian between the equator and that latitude, on a Mercator chart. This value is tabulated in the nautical tables, assuming the earth to be a spheroid in shape
Calculations –
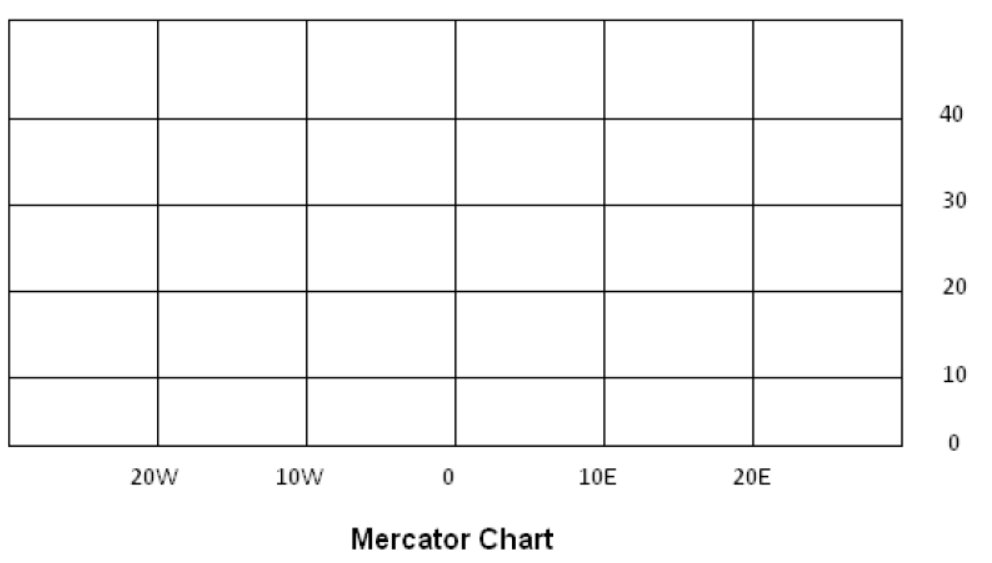
Look at the figure which shows a Mercator chart. Mercator sailing is recommended to be
used when the distance between two positions exceeds 600 nautical miles, in order to get more accurate results than by plane and parallel sailing methods. Mercator sailing method is used to find the rhumb line course and distance between two positions, the latitudes
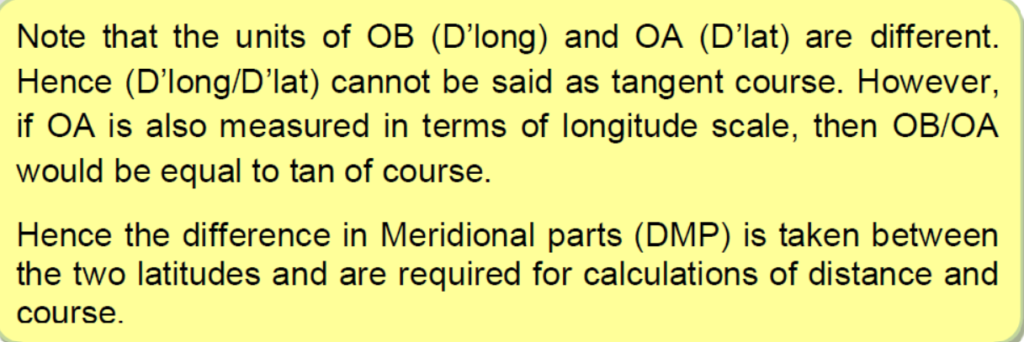
and longitudes of which are known. Refer to the Figure above The Rhumb line course is laid from A to B AB is the distance from A to B Angle OAB is the course AO is the D’lat
and OB is the D’long
Formulas used:
D’long / DMP = tan course
Distance = D’lat x sec course.