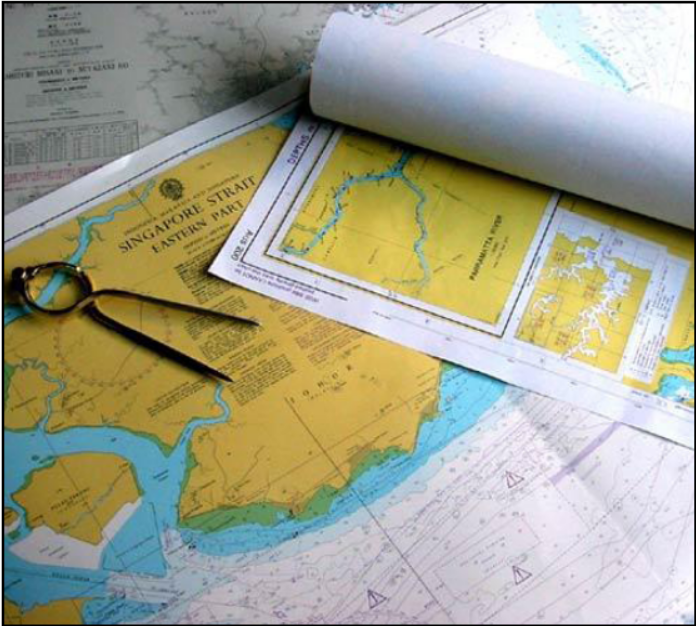
A navigational chart is a 2-dimensional representation of a 3-dimensional world. And although it results in various distortions, as long as the following two requirements are met we can use this image for navigational purposes.
i. The angles between three objects in the chart should be the same as the angles between the real objects which they represent.
ii. A straight course should appear as a straight line in the chart.
To fulfil these demands a nautical chart requires parallels and meridians that are both straight and parallel. Moreover, the meridians will need to be perpendicular to the parallels. Various methods and projections are in use for various purposes but the two most important for us to know, and are widely used on board merchant vessels, are detailed below.
A) Mercator projection

A well known method to create a chart satisfying the above two conditions is called the Mercator projection named after Gerard “Mercator” Kremer, a Flemish scholar who studied in the Netherlands and Leuven (now Belgium) and who invented his famous projection in 1569.
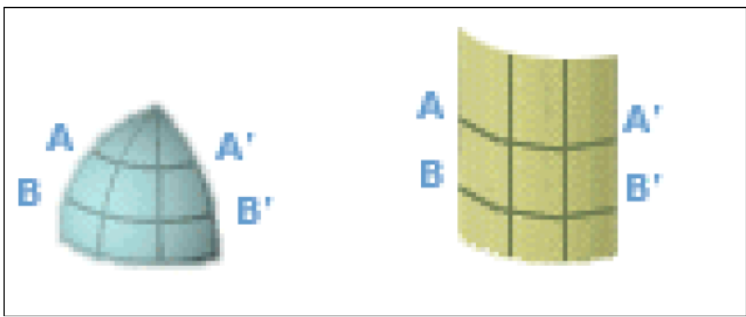
The mercator chart was designed for sailors and can be constructed by wrapping a cylinder around the planet so that it touches the equator. To a navigator, the most useful chart is where he can show the track of his ship by drawing a straight line between his starting point and his destination and the Mercator chart is constructed to allow for this requirement (Rhumb line course). On this cylinder the surface of the earth is projected and finally the cylinder is cut open to yield the 2-dimensional chart. But where the meridians converge on the globe they run parallel in the projection, indicating the distortion, for example, at a high parallel. The length of such a parallel on the globe is much smaller than the equator. Yet, on the chart they have exactly the same length creating a distortion which gets bigger nearer to the poles. Figure shows the construction of the mercator projection. From this it is clear that only the vertical scales should be used for measuring distances.

The vertical scale shown demonstrates the distortion. The two little lines drawn next to
the scale are precisely of the same size. However, the upper one measures only 0.64
degrees (= 38.4 nm) while the other measures 1.00 degrees (= 60 nm). So, distances
(in degrees or in miles and minutes) should not only be read on the vertical scale, but
also at approximately the same height.
The horizontal scale is only valid for one latitude in the chart and can therefore only be used for the coordinates (a point, but not a line). If you divide the surface of the earth in eight pieces, and lift one out and project it, the result will be as shown in figure 4. The result is that both A-A’ and B-B’ are now as long as the bottom of the chart, which is not the case at all.
B) Gnomonic projection

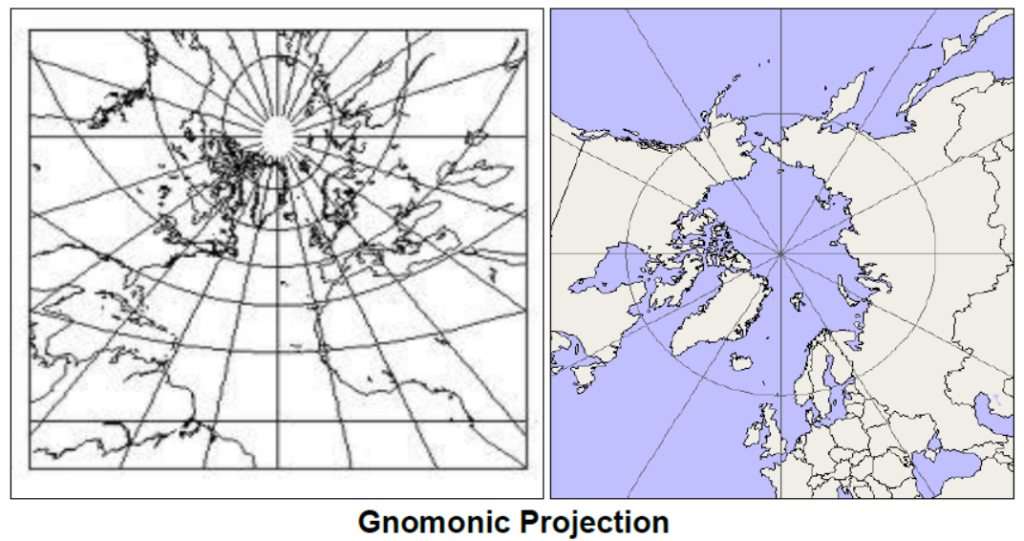
Another important projection used on board ships is the gnomonic projection on which the meridians are converging. But most importantly, the parallels are arcs of a circle while great circles appear as straight lines. On a sphere the shortest route between A and B is not a straight line but an arc (part of a great circle). On a gnomonic chart, this shortest route (a great circle) ends up as a straight line. Hence, the gnomonic projection is particularly useful when sailing great circles (especially transoceanic voyages).
Ships fitted with ECDIS also have electronic charts, Vector or Raster scan charts, which have been described in detail in ECDIS module.


