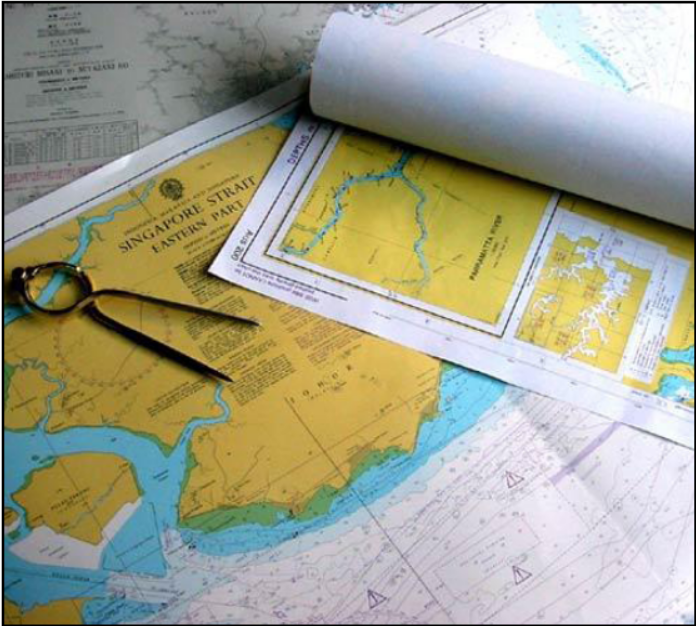
Navigational charts are either metric charts or fathom charts. They can be easily distinguished by the colour used on the charts. On the metric charts the land masses are shown in yellow colour where as on fathom charts land is shown in grey colour.
With the permission of your chief officer or duty officer take out one metric chart and one fathom chart and note the relevant information as discussed below.

Do you know how to identify a chart? Each chart is identified by its chart number which is printed on left top and right bottom corners outside the margin. Did you notice the basic colour difference between a Metric chart and a Fathom chart as mentioned above? Look below the title of the chart which has a phrase stating “Depth in Meters” or “Depth in fathoms”. Sometimes you may also find statement like “Soundings in meters” or “Soundings in feet or fathoms”. These statements also indicate whether the chart is metric or fathom chart. Now look at the title of the chart which gives the name of the chart or the area where the chart is applicable. The name or the title of the chart is at the most conspicuous place and it is placed in such a way as to not to interfere with any navigational information given on the chart. Below the title of the chart, look for some additional information given like unit of height and depths (have explained earlier), references datum used, type of projection and natural scale of the chart. Do you know what a natural scale of the chart is? It is the ratio of unit distance (length) on the chart to the corresponding distance on the earth’s surface (both measured in same units). For e.g. if the natural scale is 1:25,000 – this means that 1 cm length of chart corresponds to 25,000 cms on the earth’s surface. Can you locate the compass rose on the chart? These are compass engravings to facilitate plotting of bearings, directions and courses. Some of these have two concentric rings – the outer one representing the true north directions and the inner one representing the magnetic north. Bottom corner gives the Date of edition of the chart. This indicates the date when this chart was partly or completely revised and published. Note down the new edition of both the charts which you have picked out. Corrections to charts both small and large are printed on the left hand corner below the bottom margin. This is described in detail in the chart correction module. The vertical scale on the left and right hand side is known as the Latitude scale and the scale on the top and bottom is known as the Longitude scale. Distance on a mercator chart is taken on the latitude scale. The latitude and longitude are marked in degrees and minutes (10 = 60 minutes) and each minute of the latitude scale corresponds to 1 nautical mile on the chart (at the same latitude). For e.g.: If the ship is at 200N latitude and if you have to measure a distance in the same place, then you should use the latitude scale at 200N. Similarly distances on a chart between two positions is therefore measured along the latitude scale in between the corresponding latitudes of the two positions. On metric charts, depths are given in metres and sometimes in meters and decimetres where as heights are always printed in metres. For e.g.: 86 on a metric chart indicates a depth of 8 metres and 6 decimetres. On a fathom chart 94 indicates depth of 9 fathom and 4 feet. (1 fathom = 6 feet). Source data: On all modern charts, the Source data inset is placed at a convenient location indicating source of hydrographic information used in construction of the chart. This includes the year, name of the agency and scale of hydrographic survey of each section of the chart. Chart datum: It is the lowest level of water that is reached (rarely, if ever) in that location. Charts datum is defined as a level so low that the tide will not frequently fall below it. Modern practice is to establish datum at or near the level of lowest astronomical tide (L.A.T). L.A.T. – is the lowest level which can be predicted to occur under average Meteorological Conditions and under any combination of astronomical conditions. Storm surges may however cause lower levels to occur.
All depths and drying heights are measured from this arbitrary level. Some features of the coast are exposed during low water or low tide. Such features are generally referred to as drying heights and are usually indicated with numbers underlined. For e.g. 5 (On a metric chart, this means that the drying height is 5 metres). Continuous lines with sounding figures, circling an area or a line zig-zagging along the coast represent depth contours. These are lines joining areas with the same depth measured from the chart datum. Heights of mountains cover a large area but the point at which the height is measured is indicated by means of a point. For e.g.: 245 means the height of that point is 245 metres. Soundings below 5 metres are indicated by light blue colour on a metric chart and a light blue colour strip (ribbon) is printed towards shallow side of 10 metre depth contour. Blue tint, in one or more shades and tint ribbons, are shown to different limits according to the scale and purpose of the chart and the nature of the bathymetry.


